
-
.Net
-
Backup
-
Data Storage Containers
-
Docker Containers
-
Environment Management
- Swap-Domains
- Clone Environment
- Create Environment
- Environment Aliases
- Environment Aliases
- Environment Migration between Regions
- Environment Regions
- Environment Transferring
- Environment Variable
- Environment Variables
- Environment Variables(Apache meaven, Memcached)
- Environment Variables(Go)
- Environment Variables(JAVA)
- Environment Variables(Load Balancer)
- Environment Variables(Node.js)
- Environment Variables(PHP)
- Environment Variables(Ruby)
- How to Migrate a WordPress Site to BitssCloud PaaS
- How to migrate my environments from another Jelastic provider?
- HTTP Headers
- Java VCS Deployment with Maven
- Setting Up Environment
- Share Environment
- Why is my environment in sleeping mode?
- Show all articles9 Collapse Articles
-
Java
- Environment Variables - Java custom Environment Variables
- Java App server Configuration
- Java Options and Arguments
- Multiple Domains on Tomcat server
- Secure Java Encryption and Decryption
- Spring Boot Standalone and Clustered Java Applications with BitssCloud
- Timezone Data for Java/PHP App Server
- Tomcat HTTP to HTTPS redirect
- WildFly server
-
LiteSpeed Web Server
-
OOM Killer
-
Python
-
Reseller SetUp
-
Secure Socket Layer (SSL)
-
Troubleshooting
-
Account Management
-
CDN
-
Databases
- Database Configuration
- Database Connection Strings
- Database Hosting in BitssCloud
- Environment Variables(Database)
- Galera Cluster not working
- How to export/Import Database via Command line
- How to install MSSQL server on Linux (2017)
- MariaDB/MySQL Auto-Сlustering
- MongoDB Database Backups
- PostgreSQL Database Backups
- PostgreSQL Database Replication
- PostgreSQL Master-Slave Cluster
- Remote Access to PostgreSQL
- Schedule Backups for MySQL and MariaDB Databases
- Scheduling Databases Backups
-
Domain Name Management
- Container Redeploy
- Custom Domain Name
- DNS Hostnames for Direct Connection to Containers
- How to Bind Custom Domain via A Record
- How to Bind Custom Domain via CNAME
- Multiple Custom Domains on an Nginx Web Server
- Multiple Domains with Public IP
- Multiple Public IP Addresses for a Single Container
- Setup WordPress Multisite Network with Domain Mapping and CDN
-
Jenkins
-
Load Balancing
-
PHP
- Creating Environment for PHP
- Deploy PHP Project Via GIT SVN
- How to Check Change PHP Version in BitssCloud
- How to create environment for AngularJs/ReactJs
- How to Enable PHP Extensions
- How to Install Custom PHP Application
- Ion cube Loader
- MariaDB PHP connection
- MySQL PHP Connection
- NGINX PHP
- PHP App Server Configuration
- PHP Connection to MongoDB
- PHP security settings
- PHP Session Clustering
- PostgreSQL PHP Connection
- Running Multiple Domain Names on Apache Server
- Security configuration for Apache
- Zero Downtime (ZDT) Deployment for PHP
- Show all articles3 Collapse Articles
-
Release Notes
-
Ruby
-
SSH
-
Wordpress
-
Application Management
-
Cluster
-
Deploying Projects
-
Elastic VPS
- CentOS VPS
- Elastic VPS configuratation
- Elastic VPS with full root access
- Installation of cPanel in BitssCloud
- Java Console Application with CentOS VPS
- Linux VPS Access via Public IP
- Linux VPS Access via SSH Gate
- Setting Mail Server Inside CentOS VPS
- Setting Mail Server Inside CentOS VPS
- SSH Access to VPS Gate
- Ubuntu VPS
- Ubuntu with CSF Firewall
-
High Availability
-
Jitsi
-
Node.js
-
Pricing System
-
Request Handling
-
Scaling
- Application Server with horizontal scaling
- Automatic Horizontal Scaling
- Automatic Horizontal Scaling: Multi Nodes
- Automatic Vertical Scaling
- Database Horizontal Scaling
- Docker Containers Horizontal Scaling
- Horizontal Scaling
- Load Balancer with horizontal scaling
- Memcached horizontal scaling
- Storage Container
- VPS Horizontal Scaling
-
Traffic Distributor
-
General
- Apache & NGINX Modules
- BitssCloud Dashboard Guide
- Build and Deploy Hooks
- Cron Job scheduler
- FFMPEG Setup
- File Synchronization
- FTP Overview
- FTP/FTPS Support in BitssCloud
- How to Deploy Magento into BitssCloud PHP Cloud
- How to Enable Expert Mode in JCA
- How to open a support ticket to BitssCloud
- Installation of FTP
- Kubernetes Cluster
- MarketPlace
- Reduce Cloud Waste with Automatically Scheduled Hibernation
- Run Configuration
- SFTP Protocols for Accessing BitssCloud Containers.
- Supported OS Distributions for Docker Containers
- Timezone Addon
- Two-Factor Authentication
- Types of Accounts
- Varnish
- Websockets Support
- What is Cloudlet
- What is PaaS & CaaS
- WordPress AddOn
- Zero Code Change Deploy with No Vendor Lock-In for Smooth Migration across Cloud Platforms
- Show all articles12 Collapse Articles
-
Go lang
-
Wordpress category
-
Data Storage Container
-
Memcached
-
Account & Pricing
Statistics Monitoring
Statistics Monitoring at BitssCloud
Statistics monitoring is an easy but powerful tool, that helps to manage environments smartly. The information, provided by the BitssCloud in-built statistics module, covers all the billable resources’ consumption, so it can help to adjust the topology according to your needs and to cut the spending greatly.
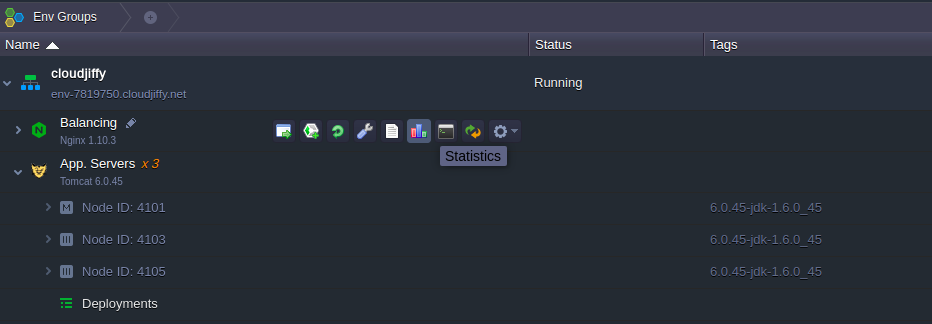
View Statistics
You can track the usage statistics for all the nodes in your environment: application servers, balancers, web servers, and databases. For that, just click the corresponding button next to the desired instance (or set of the same-typed ones):
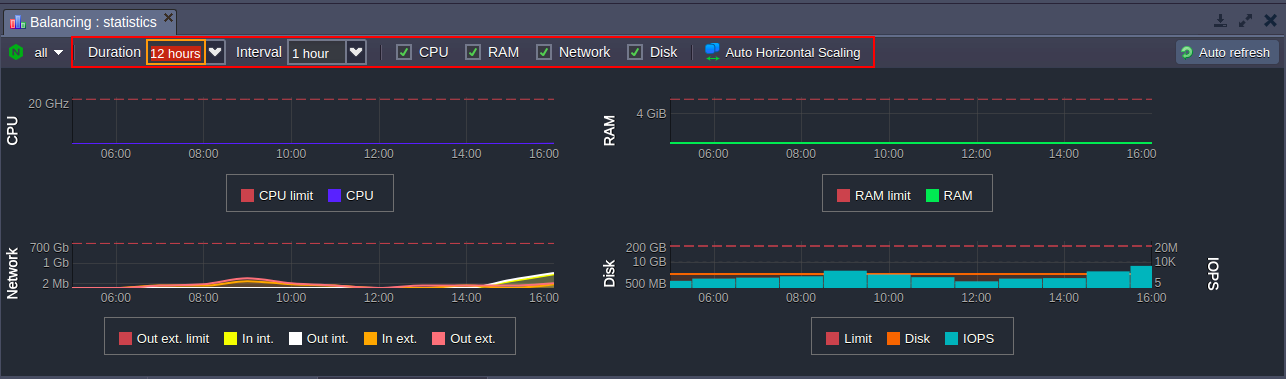
In the opened tab you’ll find the statistics on all the types of consumed resources and their limits:
- RAM – memory consumption (in Mb)
- CPU – processor load (in MHz)
- Network – internal and external traffic (in Mb)
- Disk – stored data amount (in Mb) and I/O operations amount (in IOPS)
Herewith, the RAM and CPU limits depend on the number of cloudlets you’ve allocated for a node, while the Network, Disk and IOPS ones are defined by your hosting provider.
You can further analyze the presented statistics by varying the interval and duration settings and enabling/disabling the particular sections at the top tools panel:
Tip: hover over the desired graph to get detailed information for a particular time frame.
Using the statistics data you can easily track the resources consumption of your application, thus analyze and predict your future spends and, as a result, be able to choose the best way to manage your environment. For even more convenience, you can configure the set of load alerts to be notified about the consumption level growth or wane to the specified percentage via email. This can greatly help you to save your money!
To get additional information on resource charging, see the corresponding document.And below we’ll consider the specifics of I/O usage tracking in more details.I/O Usage Monitoring
The Input/Output Operations per Second amount monitoring is the very common and popular storage measurement method, which helps to analyze the container’s efficiency based on its ability to handle a particular number of reading and write operations simultaneously without the performance degradation.
Note that currently IOPS statistics for the Windows-based nodes is not provided.
1. IOPS data is shown within the Disk statistics section by means of the second axis to the right of the graph (we’ve disabled all the rest of sections to concentrate on the information we are actually interested in):
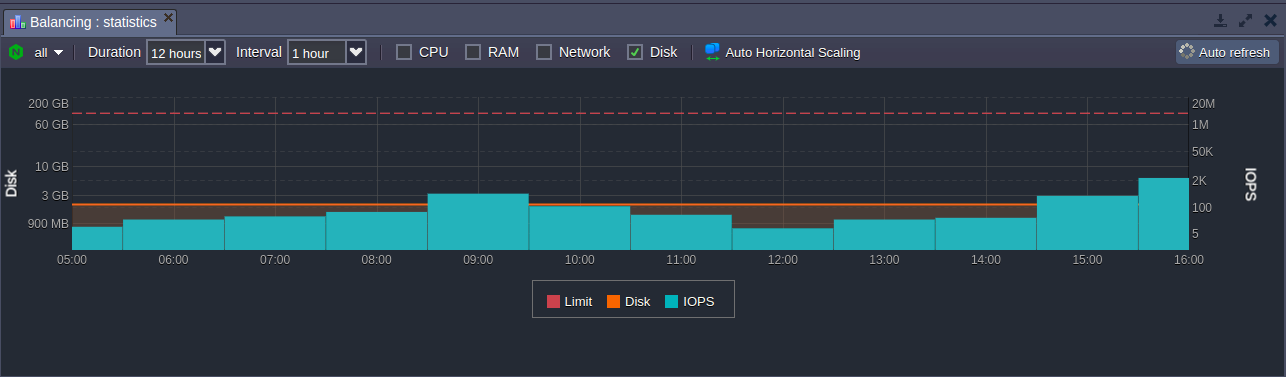
Obviously, the more operations are handled – the higher the system load is. Thus, to avoid the hardware efficiency degradation, the allowed IOPS amount is limited – the appropriate threshold (defined by your hosting provider) is marked with the red dotted line at the top of the graph.
Reaching this point implies that the performance of your container can be negatively affected, so it is needed to enlarge the number of servers used or to optimize the application itself.
2. Upon hovering over the particular point at the Disk/IOPS graph, you’ll see the popup tooltip with the following details:
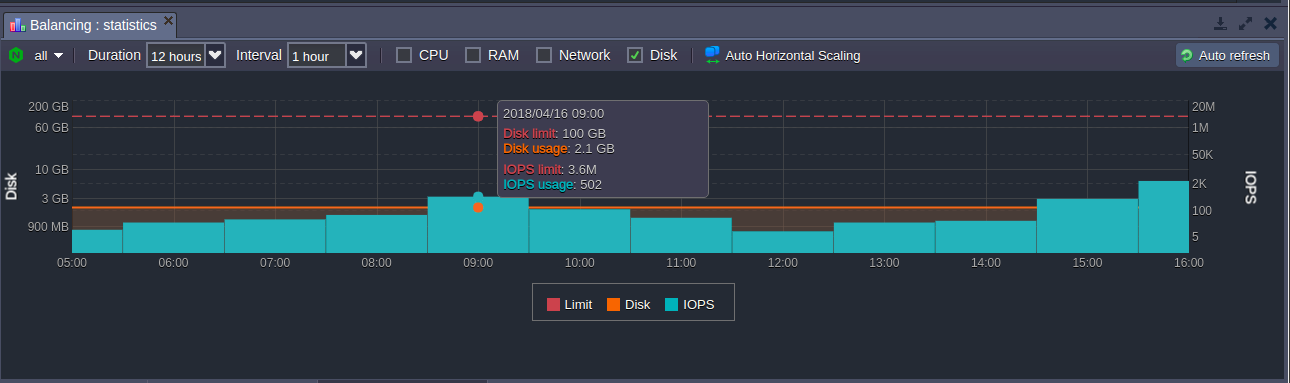
- date and time of the gathered stats
- Disk – the amount of space container is actually using
- Disk space limit – the maximum amount of data that is allowed to be stored in a container
- IOPS – the number of I/O operations handled during the stated Interval
- IOPS limit – the maximum number of I/O operations, allowed to be performed by the container during the stated Interval
Note that both limits (i.e. for Disk space and IOPS) are displayed in a single line, named Limit in the chart’s legend. Herewith, particular threshold values for each of these resource types can be seen at the appropriate axes to the left and right – for the used disk space and the amount of IOPS respectively.
3. As it was mentioned above, the IOPS limit depends on the Interval chosen. So, for example, if you state 1-hour Interval for your environment, the prior limit for 1 minute (which is equal to 6000 – see the image in the previous step) will be increased in 60 times (as 1 hour = 60 minutes):
6000 * 60 = 360 000

In such a way, you are provided with the actual disk load information and get the ability to monitor its state in real time.